
Store Locator Plus® is being migrated to an Elastic Container Service (ECS) cluster that is expected to be active Q4 2024. This cluster is to be automatically updated via the myslp_aws_ecs_kit git repo which triggers a CodePipeline build that deploys updates to the cluster.
ECS Cluster
The ECS cluster that is accessed by the pipeline is myslp-ecs-cluster.
arn:aws:ecs:us-east-1:744590032041:cluster/myslp-staging-cluster
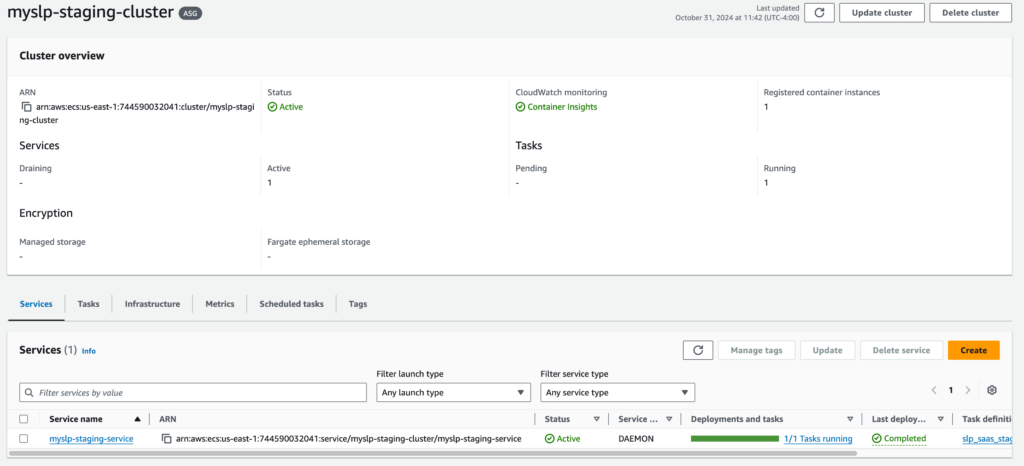
This cluster is designed to run EC2 instances that host the SLP SaaS containers.
Infrastructure
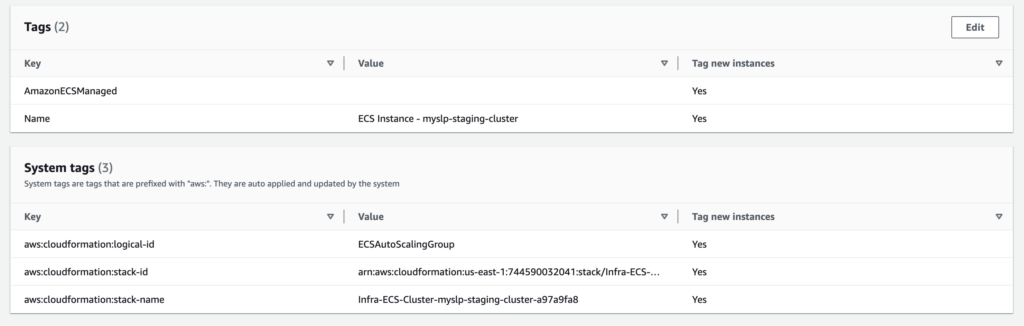
The instances are managed by the following Auto Scaling Group (ASG):
Infra-ECS-Cluster-myslp-staging-cluster-a97a9fa8-ECSAutoScalingGroup-zoFBNbZvjeFk
arn:aws:autoscaling:us-east-1:744590032041:autoScalingGroup:e0255cb5-e03b-4f35-adb4-398b947028b8:autoScalingGroupName/Infra-ECS-Cluster-myslp-staging-cluster-a97a9fa8-ECSAutoScalingGroup-zoFBNbZvjeFk
This provides the compute capacity (EC2 instances here) to run the container service that defined services will use to run tasks.
Auto Scaling Group Details
Should have a minimum capacity of 1.
The group uses the following launch template: lt-07e8f4ebedbe1c2ff
That launch template runs image ID: ami-05a490ca1a643e9ea
It runs on an “gravitron compute” instance which is ARM64 compatible. Currently it runs on a c6g.xlarge.
The system tags help associate any resources launched by this ASG with the ECS cluster. The special sauce is in the launch template inline scripts, however.
Launch Template Details
The following “advanced details” in the launch template seem to be what registers any EC2 instances that this ASG fires up with the ECS Cluster:
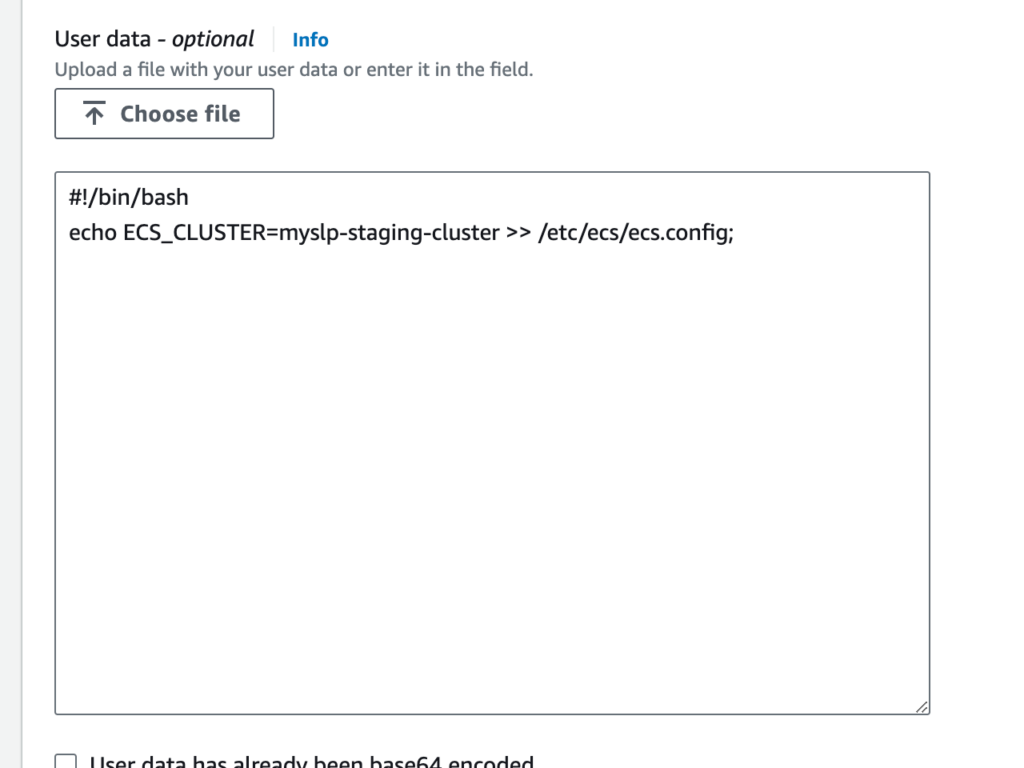
User data contains scripts or other things that run as soon as the container comes online.
The AMI likely has AWS libraries loaded, one of which is an ECS tool that works with the AWS fabric and reads the /etc/ecs/ecs.config file to figure out how to connect a resource to the cluster on boot or on a daemon service refresh.
Tasks
These are the ECS equivalent of Docker Composer files with added information about what type of container to create.
The task definition on AWS Console for the configuration below is named slp_saas_staging:3 (as of Oct 31 2024). In addition to the environment variables noted below, an addition environment variable is added when creating the task definitions via the console to set the WORDPRESS_DB_PASSWORD environment variable. This is set for the myslp_dashboard database (baked into the ECR image that is built with CodePipeline via the WORDPRESS_DB_NAME environment variable) with a user of myslp_genesis (also per the ECR image in the WORDPRESS_DB_USER environment variable).
From the myslp_aws_ecs_kit repo AWS/ECS/tasks/slp_saas_staging.json
{
  "family": "slp_saas_staging",
  "requiresCompatibilities": ["EC2"],
  "runtimePlatform": {
    "operatingSystemFamily": "LINUX",
    "cpuArchitecture": "ARM64"
  },
  "networkMode": "awsvpc",
  "cpu": "3 vCPU",
  "memory": "6 GB",
  "executionRoleArn": "arn:aws:iam::744590032041:role/ecsTaskExecutionRole",
  "containerDefinitions": [
    {
      "name": "slp_saas",
      "essential": true,
      "image": "744590032041.dkr.ecr.us-east-1.amazonaws.com/myslp2024-aarch64:staging",
      "portMappings": [
        {
          "containerPort": 80,
          "hostPort": 80
        }
      ],
      "environment" : [
        {
          "name" : "WP_HOSTURL",
          "value" : "staging.storelocatorplus.com"
        },
        {
          "name" : "WP_HOME",
          "value" : "https://staging.storelocatorplus.com/"
        },
        {
          "name" : "WP_SITEURL",
          "value" : "https://staging.storelocatorplus.com/"
        },
        {
          "name" : "WORDPRESS_DB_HOST",
          "value" : "slp-staging-2023-aug-cluster-cluster.cluster-c0glwpjjxt7q.us-east-1.rds.amazonaws.com"
        },
        {
          "name" : "WORDPRESS_DEBUG",
          "value" : "true"
        },
        {
          "name" : "WORDPRESS_CONFIG_EXTRA",
          "value": "define( 'WP_DEBUG_LOG', '/var/www/html/debug.log');define( 'WP_DEBUG_DISPLAY', true);define( 'WP_DEBUG_SCRIPT', true);@ini_set('display_errors',1);define('SUNRISE', true);defined('DOMAIN_CURRENT_SITE') || define('DOMAIN_CURRENT_SITE', getenv_docker('WP_HOSTURL', 'staging.storelocatorplus.com') );define('WP_ALLOW_MULTISITE', true );define('MULTISITE', true);define('SUBDOMAIN_INSTALL', false);define('PATH_CURRENT_SITE', '/');define('SITE_ID_CURRENT_SITE', 1);define('BLOG_ID_CURRENT_SITE', 1);if ( ! defined( 'WPMU_PLUGIN_DIR' ) ){define('WPMU_PLUGIN_DIR', dirname( __FILE__ ) . '/wp-content/mu-plugins' );}"
        }
      ]
    }
  ]
}
Services
Services run various parts of the application. For SLP in the initial Q4 2024 state there is only one service – the SLP SaaS web service.
The staging service that runs the SaaS staging task is at:
arn:aws:ecs:us-east-1:744590032041:service/myslp-staging-cluster/myslp-staging-service
The service is set to run the slp_saas_staging task in daemon mode. That means it will run one task per container.
The service definition sets up the containers.
Container Image (on ECR): 744590032041.dkr.ecr.us-east-1.amazonaws.com/myslp2024-aarch64:staging
It also sets up the environment variables passed into the container.